> ## Documentation Index
> Fetch the complete documentation index at: https://docs.platform.aiplanet.com/llms.txt
> Use this file to discover all available pages before exploring further.
# Tracing
> Inspect every workflow run step by step to understand and debug behavior.
Tracing records every run of every workflow. When a workflow doesn't behave the way you expect, the trace shows you exactly what happened — node by node.
 ## The traces list
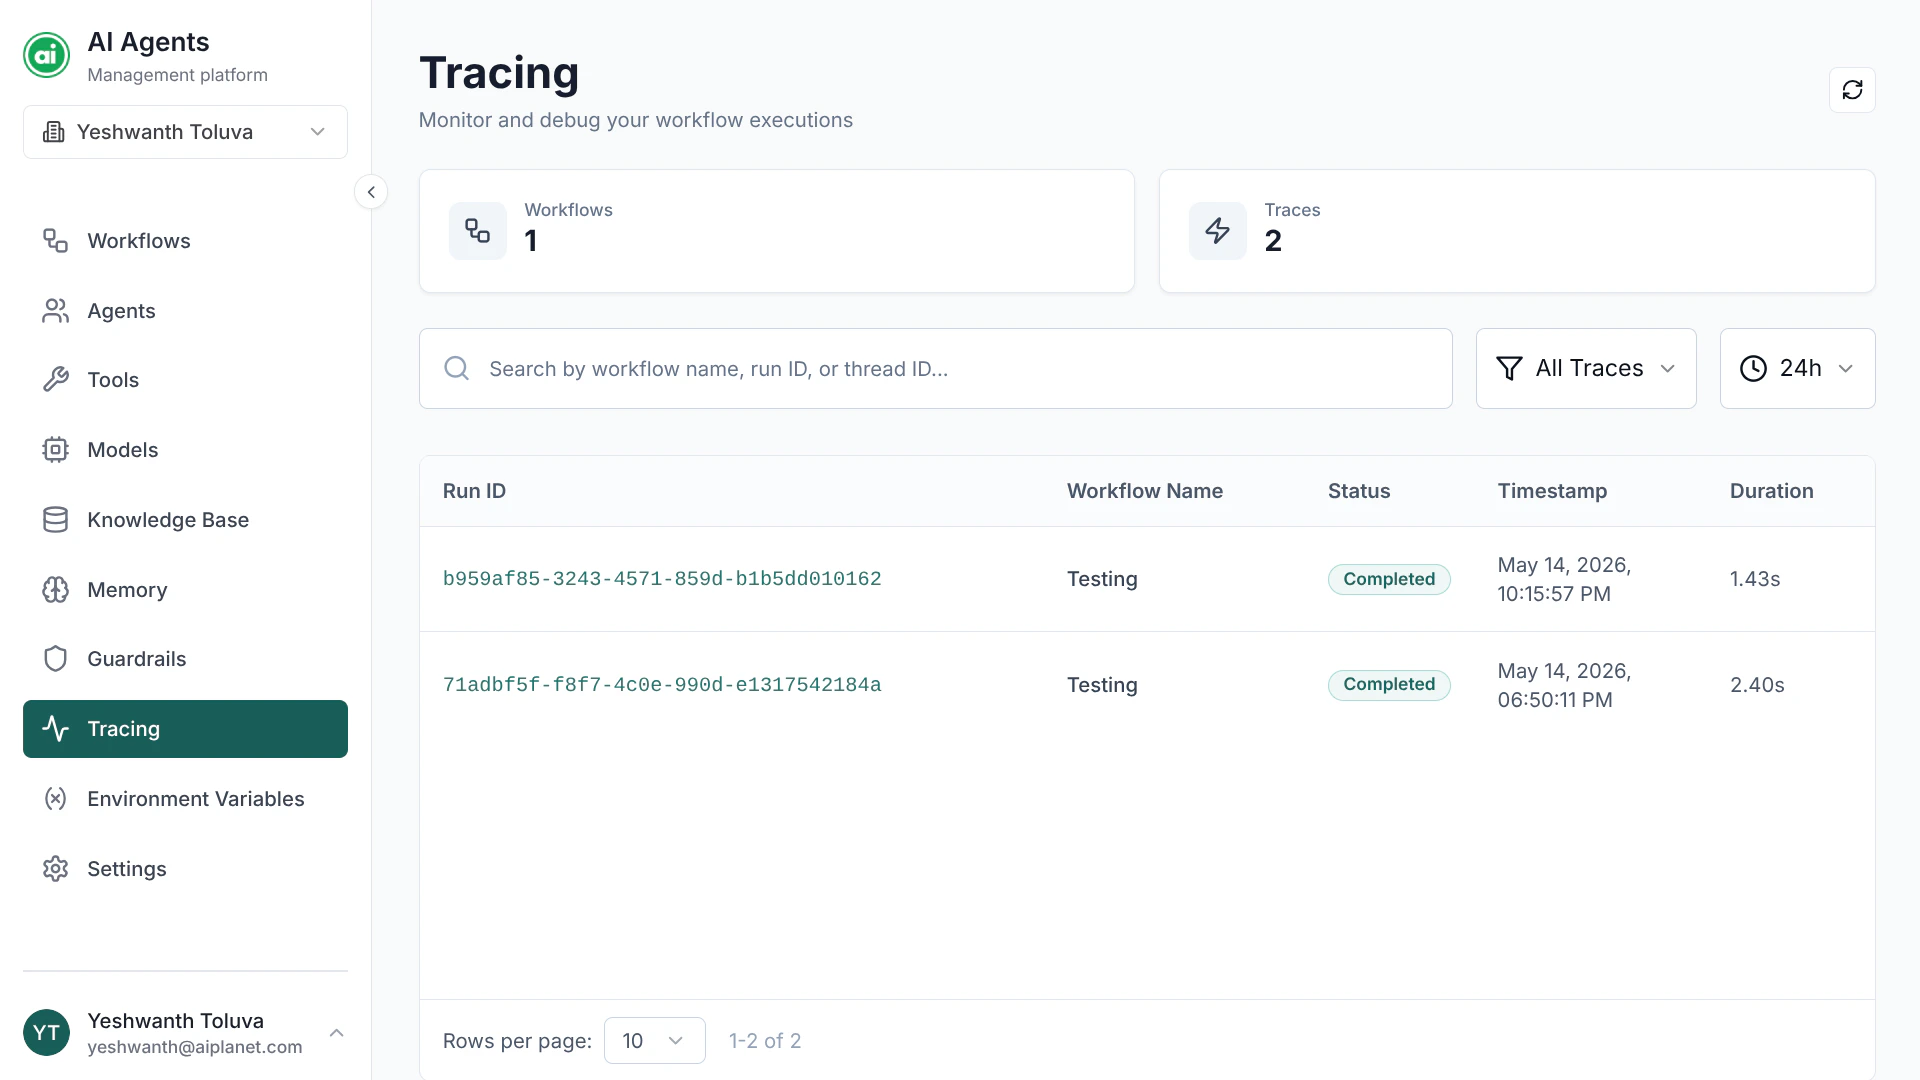
The Tracing page lists every run across your workflows. Two summary cards at the top show your total workflow and trace counts. For each run, the table shows:
* The **run** identifier
* The **workflow** it belongs to
* Its **status**
* When it ran and how long it took
## Finding a run
* **Search** by workflow name, run identifier, or thread identifier.
* **Filter** by status — Completed or Failed.
* **Adjust the time range** — from the last 24 hours up to the last year.
## Inspecting a run
Open a run to see its full detail. The **Input & output** tab shows what the run received and what it returned:
## The traces list
The Tracing page lists every run across your workflows. Two summary cards at the top show your total workflow and trace counts. For each run, the table shows:
* The **run** identifier
* The **workflow** it belongs to
* Its **status**
* When it ran and how long it took
## Finding a run
* **Search** by workflow name, run identifier, or thread identifier.
* **Filter** by status — Completed or Failed.
* **Adjust the time range** — from the last 24 hours up to the last year.
## Inspecting a run
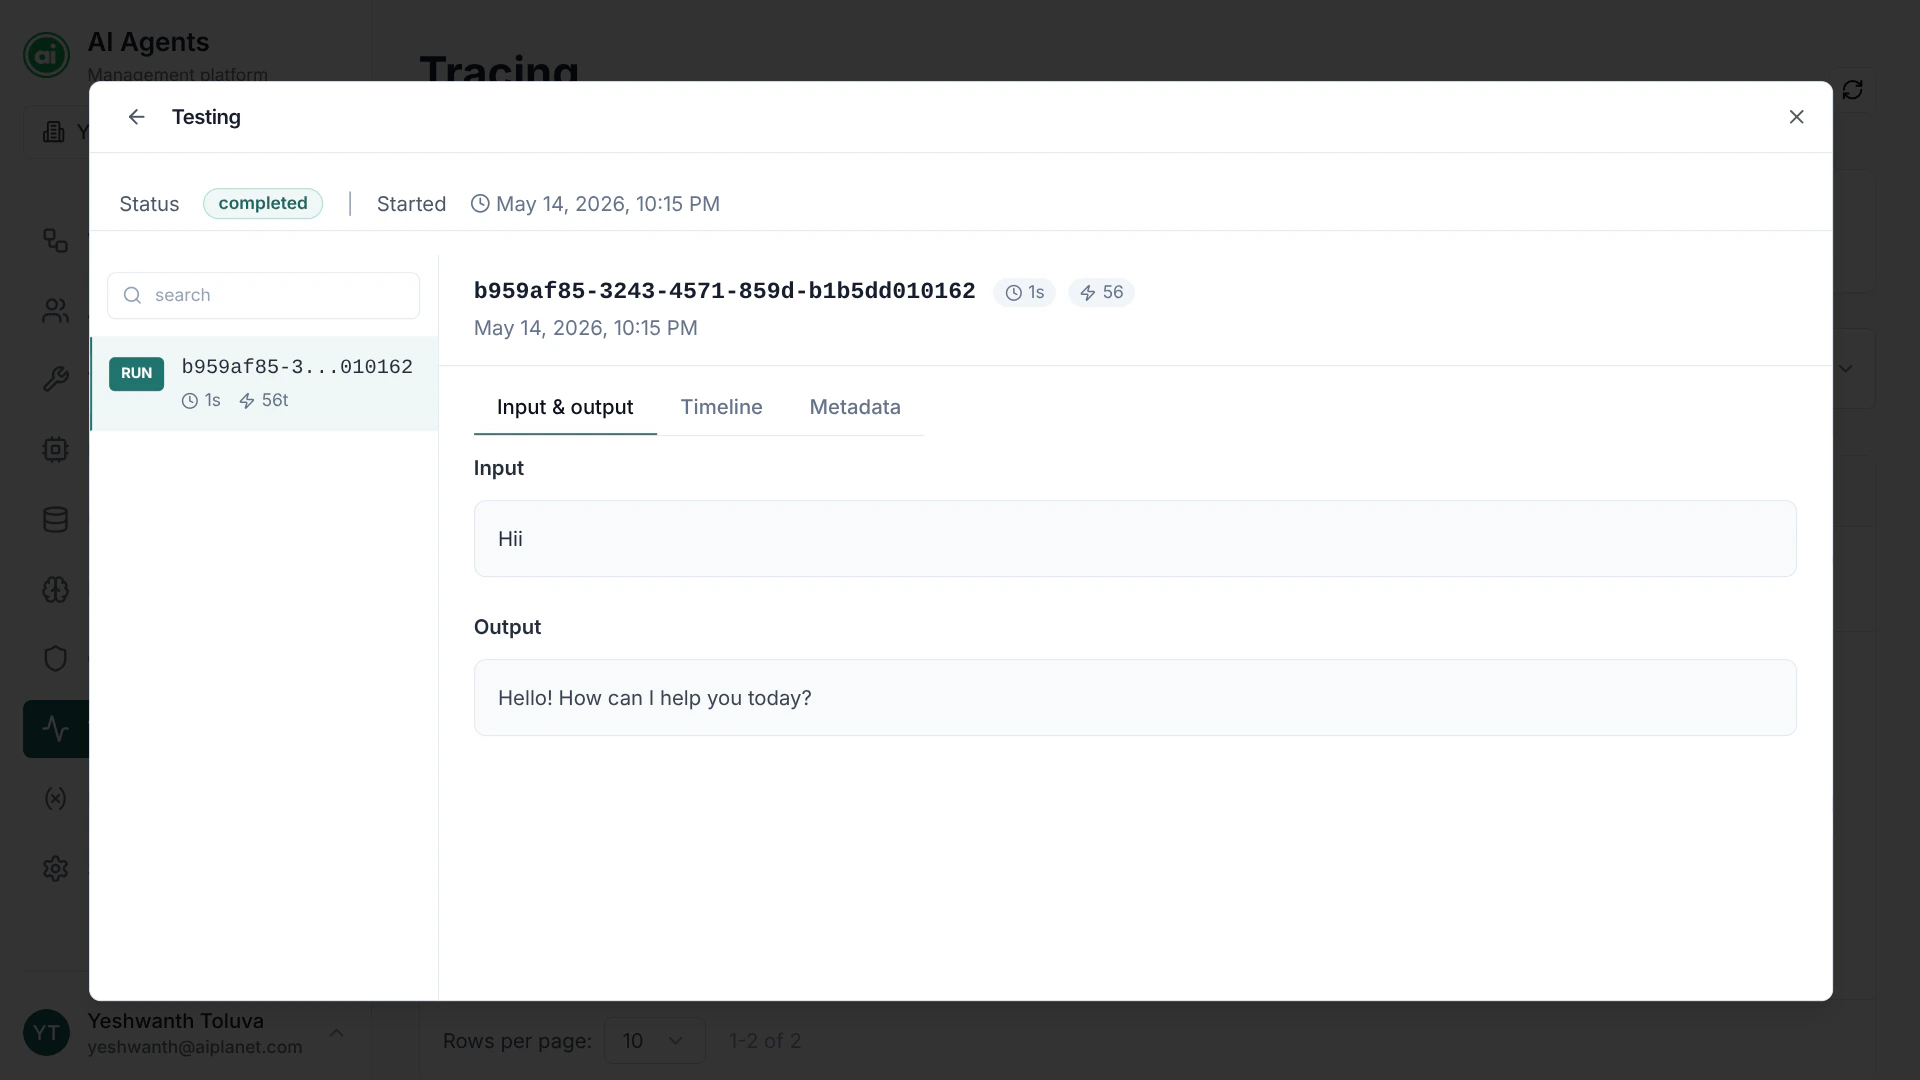
Open a run to see its full detail. The **Input & output** tab shows what the run received and what it returned:
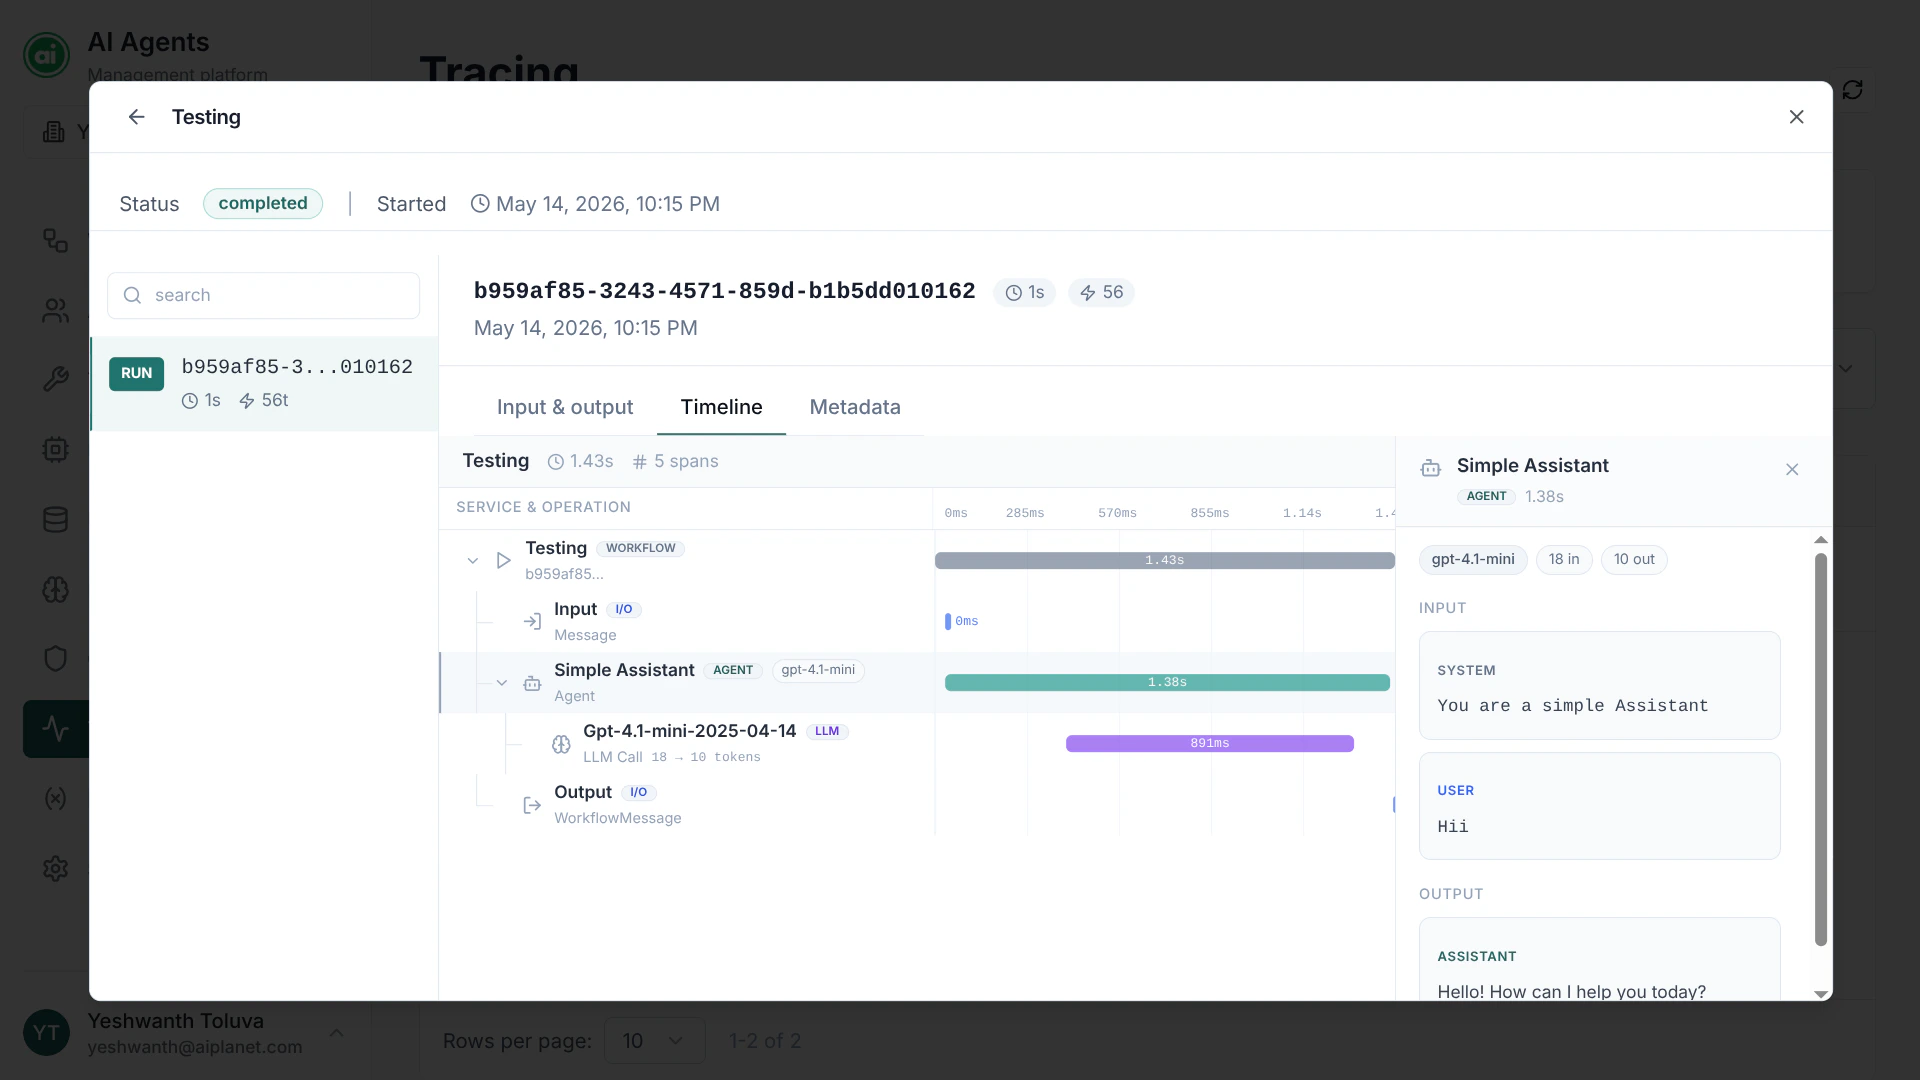
 The **Timeline** tab breaks the run down into a step-by-step sequence — every node that executed, how long each took, and the input and output at each step. Select any step to inspect it in detail:
 In short, an opened run shows you:
* The **inputs** it received.
* The **outputs** it produced.
* A **step-by-step timeline** of every node that executed, with each node's input, output, and timing.
* The **error** detail, if the run failed — including which node failed and why.
When a run fails or returns something unexpected, open its trace and read the timeline from the top. The first node whose output looks wrong is usually where the problem started.
## Why tracing matters
Tracing is your main debugging tool:
* **Failed runs** — see exactly which node failed and the error.
* **Unexpected output** — follow the data through each node to find where it went wrong.
* **Slow runs** — see which node took the most time.
* **Verifying behavior** — confirm an agent used the right tool or searched the right knowledge base.
## Next steps
Learn about concurrency and usage limits.
In short, an opened run shows you:
* The **inputs** it received.
* The **outputs** it produced.
* A **step-by-step timeline** of every node that executed, with each node's input, output, and timing.
* The **error** detail, if the run failed — including which node failed and why.
When a run fails or returns something unexpected, open its trace and read the timeline from the top. The first node whose output looks wrong is usually where the problem started.
## Why tracing matters
Tracing is your main debugging tool:
* **Failed runs** — see exactly which node failed and the error.
* **Unexpected output** — follow the data through each node to find where it went wrong.
* **Slow runs** — see which node took the most time.
* **Verifying behavior** — confirm an agent used the right tool or searched the right knowledge base.
## Next steps
Learn about concurrency and usage limits.